


Introduction
Logstash and the ELK stack (Elasticsearch, Logstash, and Kibana) are powerful tools for log management and analysis. They provide a robust solution for collecting, processing and visualizing logs from various sources. In this article, we will guide you through the process of configuring your Ruby application to ship logs to Logstash, which is part of the ELK stack.
Steps
Step 1: Install Required Gems
To get started, ensure that you have the logstash-logger gem installed in your Ruby application. You can do this by running the following command:
sudo gem install logstash-logger
This gem allows you to send logs directly to Logstash from your Ruby application.
Step 2: Create a Configuration File
Next, create a configuration file named logstash_config.yml with the following content:
logstash_host: LOGSTASH-SERVER-HOST
logstash_port: LOGSTASH-PORT
Substitute the placeholder LOGSTASH-SERVER-HOST with the actual IP address/Host of the server where you have deployed Logstash.
Update the placeholder LOGSTASH-PORT with the TCP port number that you have specified in your logstash.conf file to receive the logs.
This configuration file will be used to define the connection details for Logstash.
Step 3: Read the Configuration File in Ruby
In your Ruby application, you need to read the configuration file and use the values to configure the Logstash logger. Here's an example of how to accomplish this:
require 'logstash-logger'
require 'yaml'
require 'json'

config = YAML.load_file('logstash_config.yml')

logstash_host = config['logstash_host']
logstash_port = config['logstash_port']

logger = LogStashLogger.new(type: :tcp, host: logstash_host, port: logstash_port)
logger.formatter = proc do |severity, datetime, progname, message|
  log_entry = {
    '@timestamp' => datetime.strftime('%Y-%m-%dT%H:%M:%S.%LZ'),
    'severity' => severity,
    'message' => message,
    'host-ip' => logstash_host
  }
  log_entry.to_json + "\n"
end

(1..10).each do |counter|
  logger.info("This is log message number #{counter}.")
end
In this code snippet, we load the configuration from the logstash_config.yml file using the YAML.load_file method. Then, we extract the logstash_host and logstash_port values from the configuration.
We create a new instance LogStashLogger and configure it to connect to Logstash using the specified host and port. The logger.formatter block formats the log entry into JSON format with additional fields such as timestamp, severity, message, and the host IP address.
Finally, we generate some log messages as an example using a loop and the logger.info method. Feel free to customize the log messages according to your application's needs.
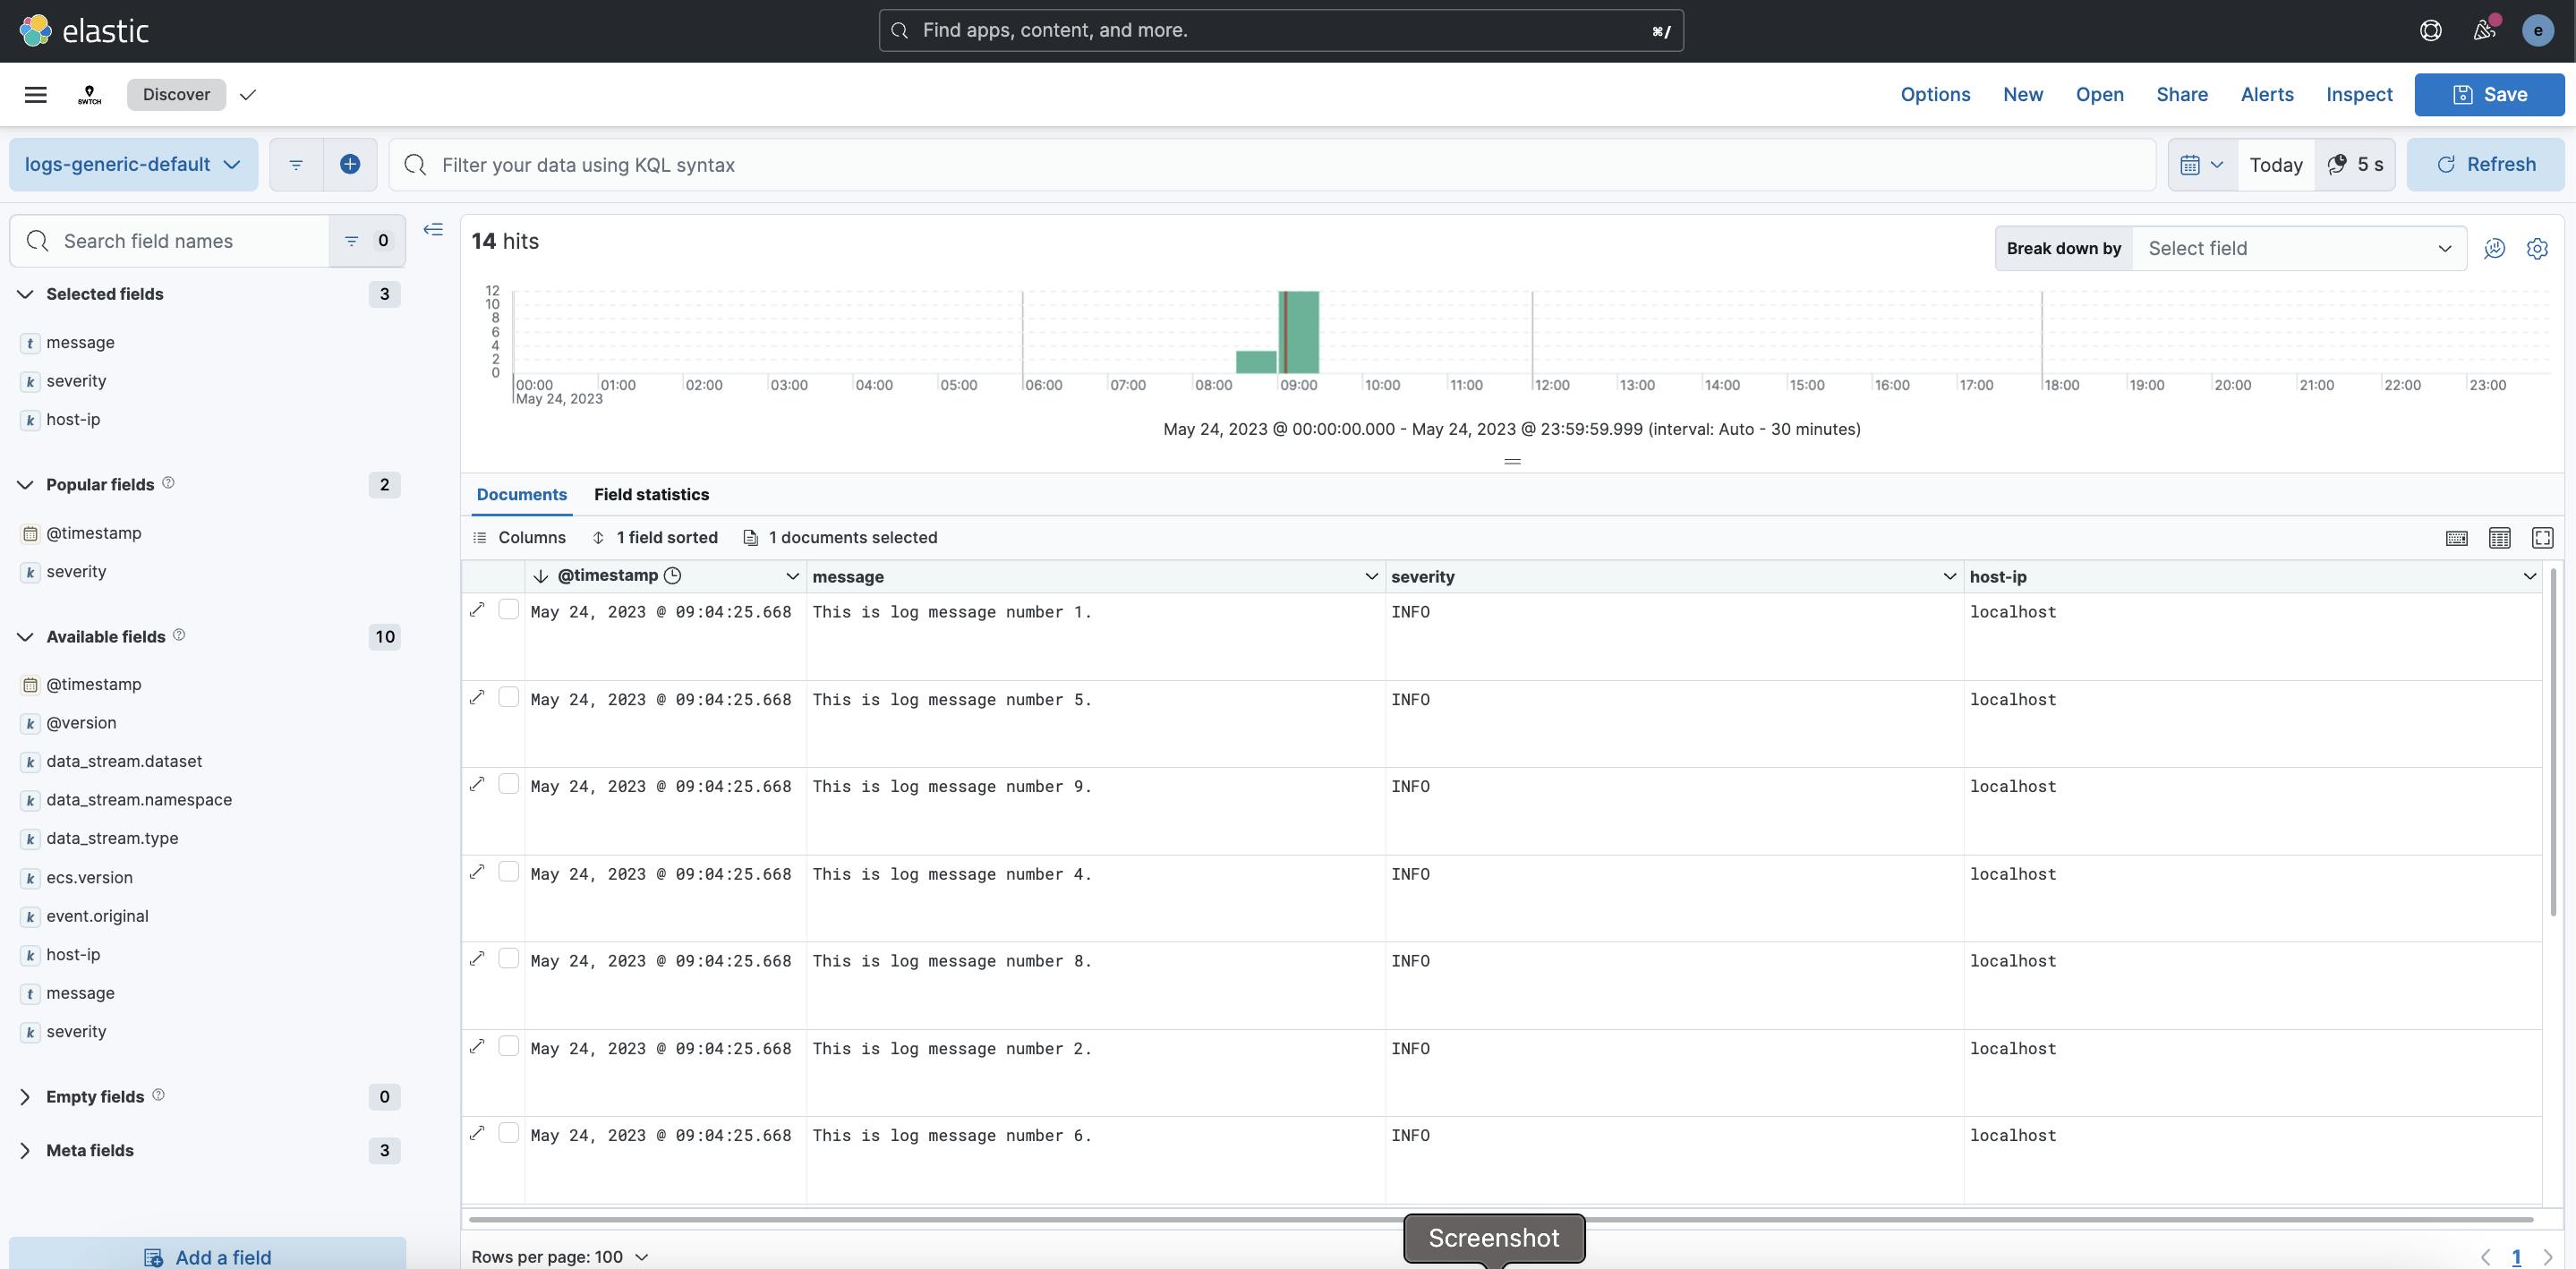
Verification
You can confirm that your logs are being successfully shipped by checking the Kibana interface, as shown in the screenshot below.
Conclusion
By following these steps, you can easily configure your Ruby application to ship logs to Logstash within the ELK stack.
Logstash provides powerful capabilities for filtering, parsing, and enriching log data, while Elasticsearch and Kibana enable you to store and visualize the logs effectively.
With this setup, you'll have a comprehensive log management system that can help you gain valuable insights and troubleshoot issues in
References
GitHub
Example code and configuration files for shipping logs from a Ruby application to Logstash in the ELK stack.
https://github.com/raowaqasakram/ruby-logstash-elk-config-example